
Every site you run, on one sheet
16 of 25 sites · Last 24h · Read only · Figures from a live account; hourly traces illustrative
Frame 12 is marked because it moved most this period, up 76.9 percent.
Works with what you already use
My Web Dash connects through Cloudflare official OAuth, read only. Sign in with Google. Nothing to install on your sites.
- Cloudflare
- GraphQL API
Cloudflare Web Analytics, without the clicks
The official page makes reading your own traffic slower than it should be. Here is what My Web Dash does instead.
CloudflareIt opens on performance, so traffic is always a click away.
My Web DashIt opens on traffic. Visitors and top pages come first.
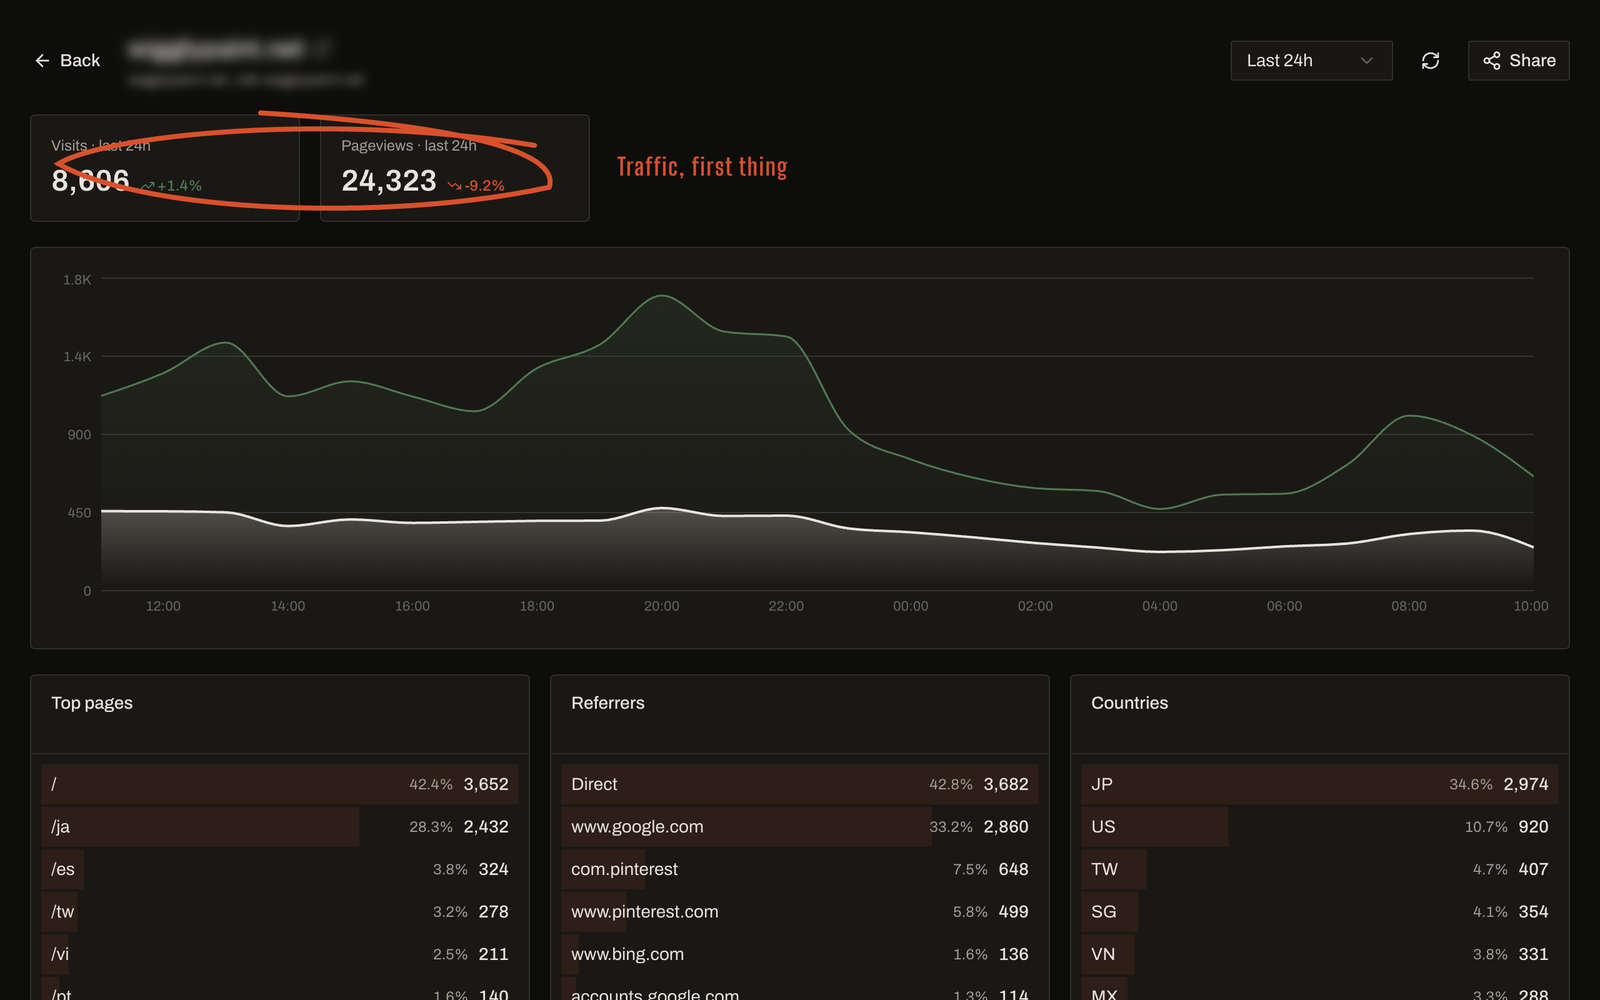
The detail page opens on traffic — visits, pageviews, the hourly curve. No tab to switch to.
What My Web Dash does
Traffic first
Visitors, top pages, and referrers are the first thing you see, not Core Web Vitals. Read your traffic without clicking through.
Your place is kept
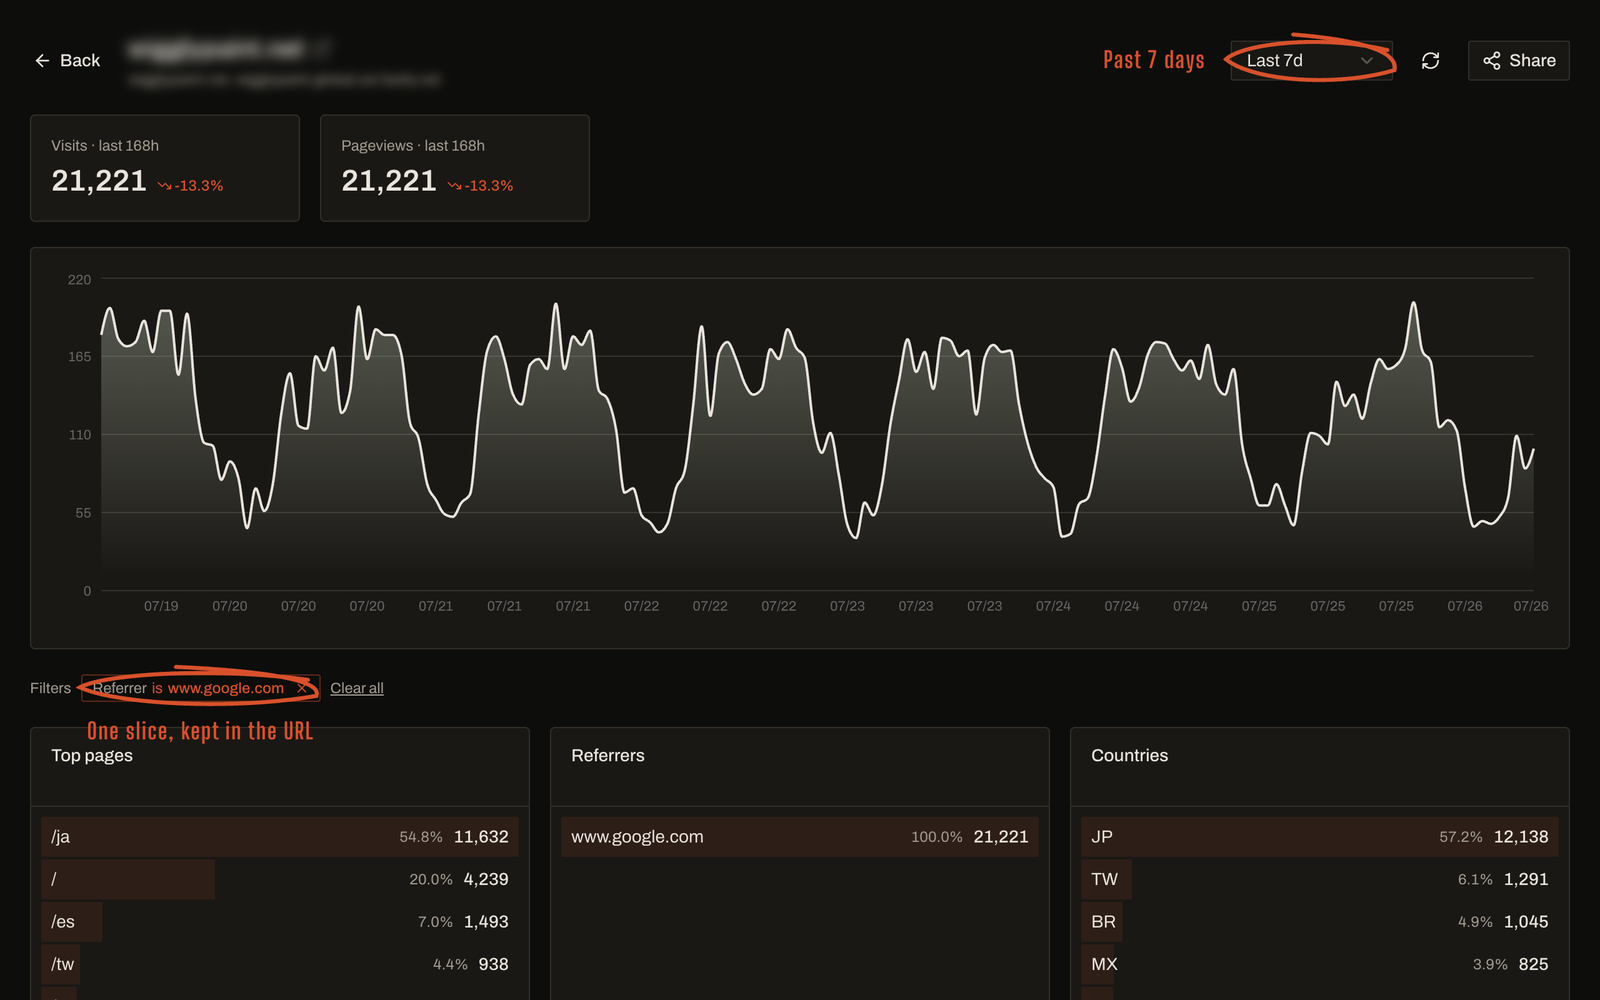
Your current view lives in the URL, so a refresh or a shared link lands right where you left off, not back at page one.
Period over period at a glance
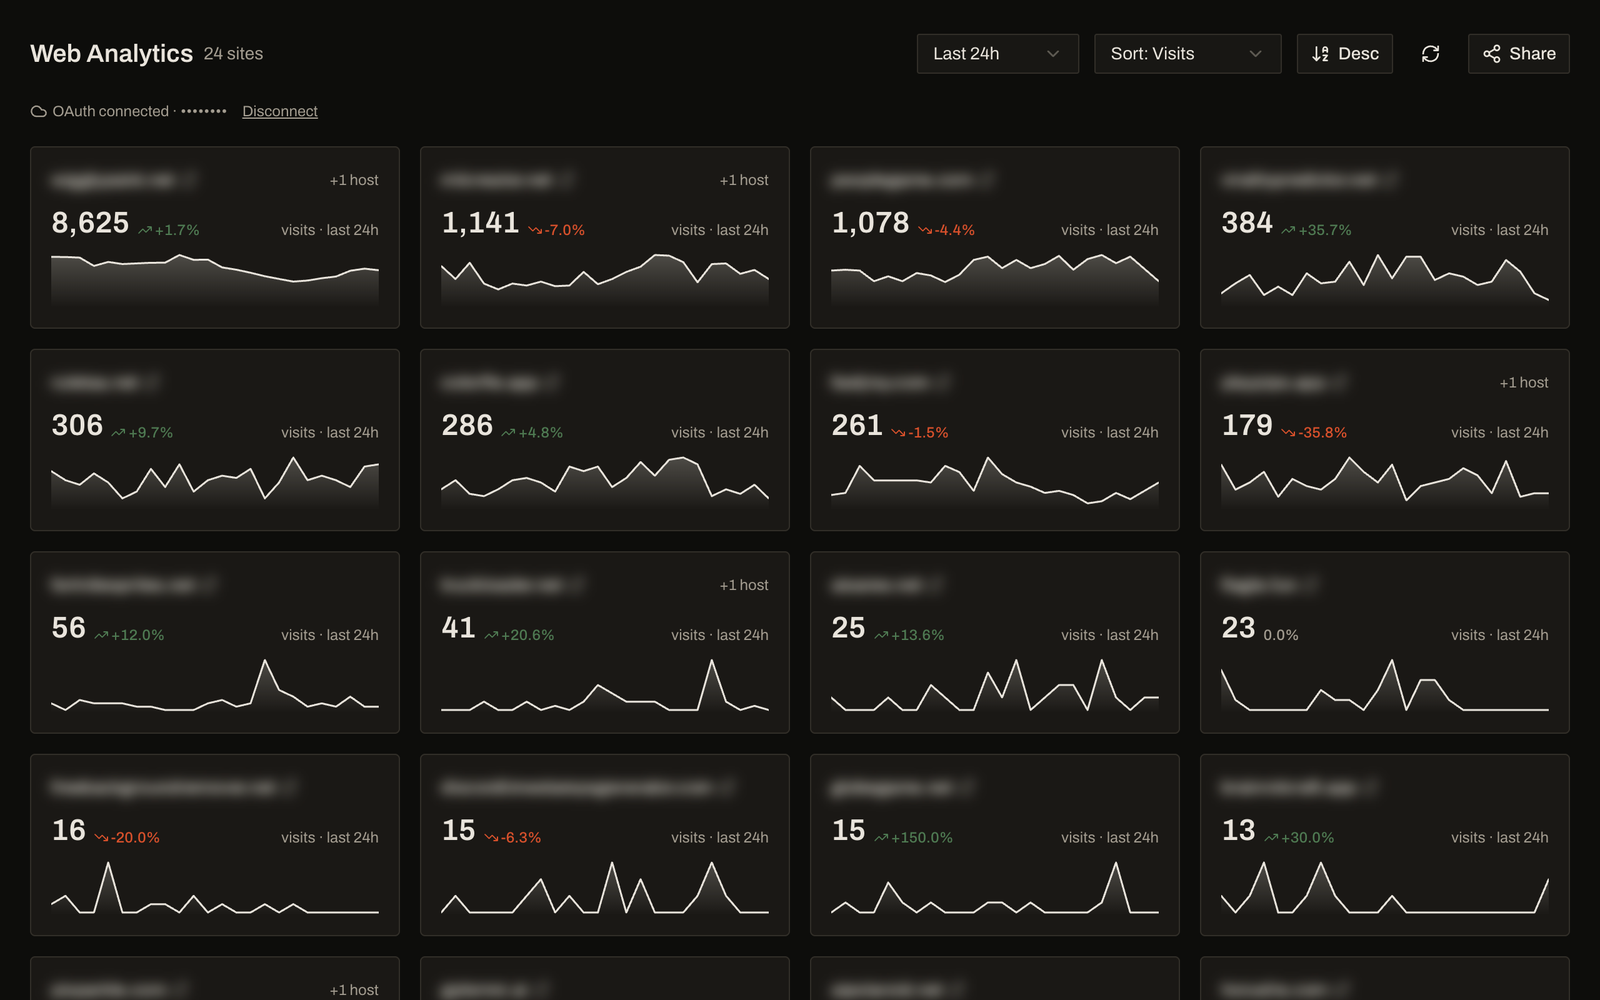
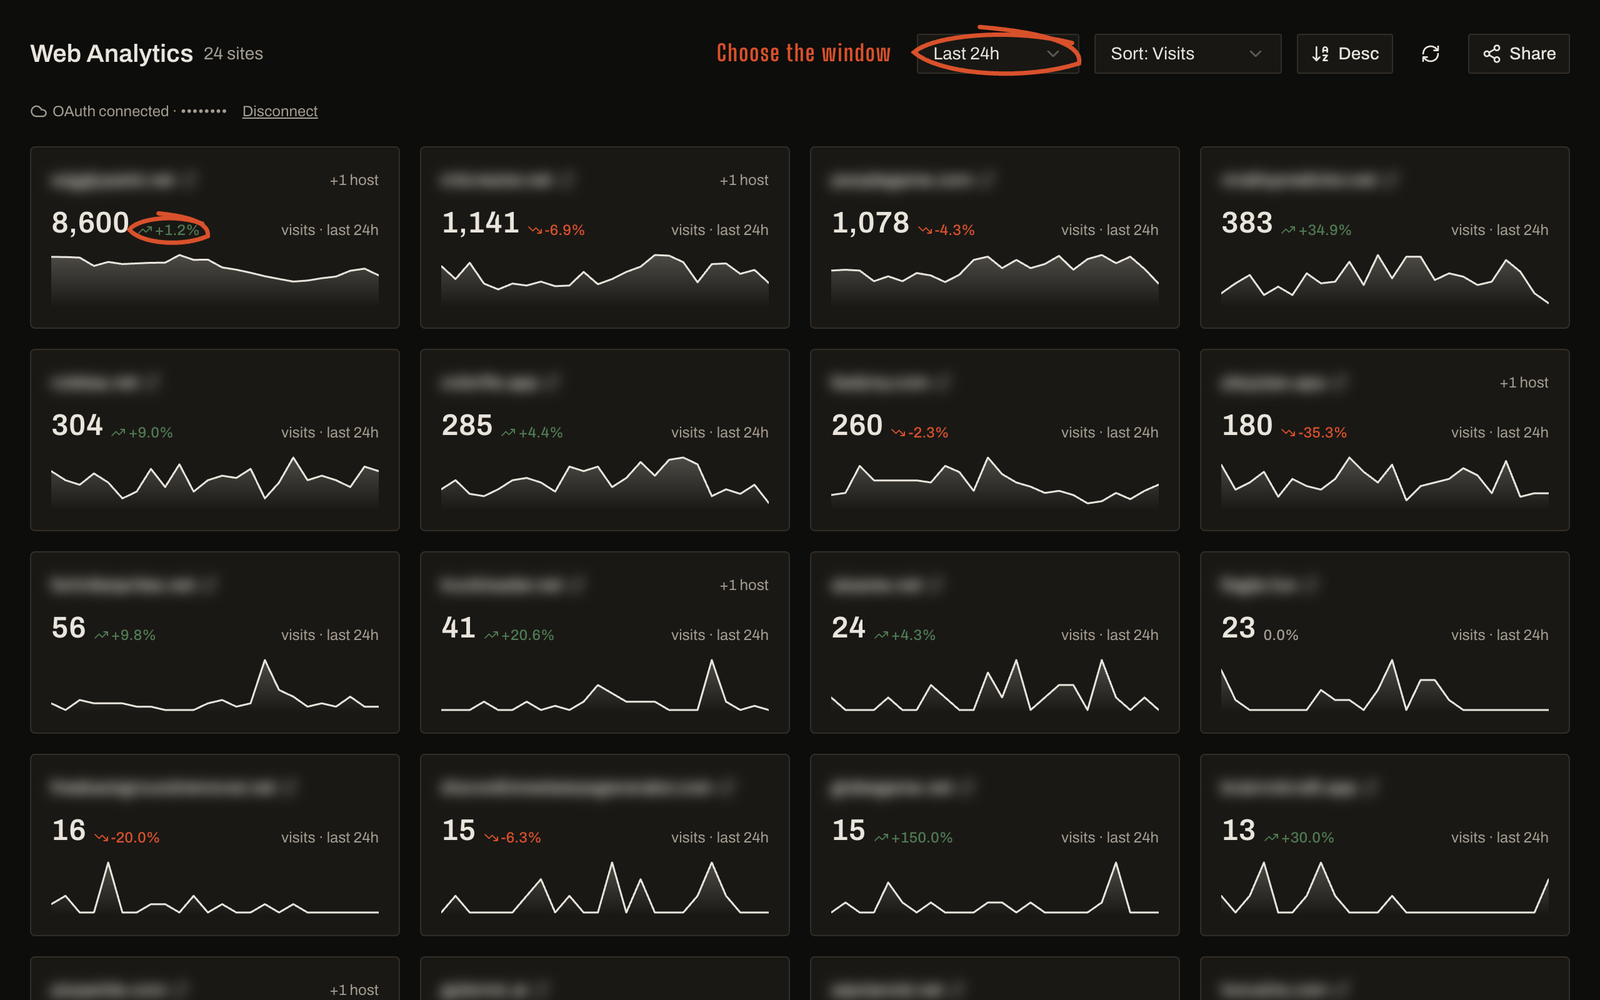
Every site shows its change versus the previous period on the card, so you see what is up or down without opening a detail page.
All your sites in one place
Connect every Cloudflare account you manage and see all your sites in one grid you can sort and search.
Filter and drill down
Slice by country, path, referrer, browser, or device, and stack filters to drill down, with more than 30 days of history.
One click connect, read only
Connect through Cloudflare official OAuth. No API tokens to generate, no write access, and you can disconnect anytime.
The Cloudflare analytics API, without writing it
Cloudflare exposes web analytics through a GraphQL API. This is what pulling one metric looks like by hand. My Web Dash does this for every site for you.
# what you write to get pageviews for ONE sitequery { viewer { accounts(filter: { accountTag: $tag }) { rumPageloadEventsAdaptiveGroups( limit: 100, filter: { datetime_geq: $start, datetime_leq: $end } ) { count, dimensions { requestPath } } } }}# now repeat per site, handle auth, paging, and the 30-day wallMy Web Dash: connect once, see every site.From scattered pages to one fast view
- 01
Connect Cloudflare
Sign in and connect your Cloudflare accounts with one click through official OAuth. Read only.
- 02
Pick your accounts and sites
Choose which accounts and sites to bring into your dashboard. Add more anytime.
- 03
See your traffic in one place
Traffic first, your filters and comparisons kept as you navigate, across every site you run.
One morning, in three moves
This is the whole ritual. Real screens, real figures from a live Cloudflare account, site names withheld.
Take in the whole roll
Every site you own on one page, sorted by traffic, each card already carrying its change. Nothing to click to find out how the night went.
- Two dozen sites
- One screen
Spot the one that moved
The change sits on the card, not behind it. A site up seventy percent and one down a third read the same way, in the same glance.
- Period over period
- On every card
Enlarge it and drill in
Open the one that matters, then slice by path, referrer, country, browser or device. The filter lives in the URL, so a refresh lands you back here.
- Five dimensions
- Filter or exclude
Why people switch to one view
Frequently asked questions
What is My Web Dash?
My Web Dash is a faster view of your Cloudflare Web Analytics. It reads your Cloudflare traffic and shows it in one place, traffic first, keeping your filters and your place as you navigate, across every site you run.
How is it different from the Cloudflare analytics dashboard?
The Cloudflare page opens on performance metrics, paginates in the browser so a refresh loses your place, and only shows period over period inside a site detail page. My Web Dash puts traffic first, keeps your view in the URL, shows the change on every site card, and brings all your sites together.
Do you get access to my Cloudflare account?
You connect through Cloudflare official OAuth with read only access to analytics. There is no write access, and you can disconnect anytime.
Is My Web Dash affiliated with Cloudflare?
No. My Web Dash is an independent tool and is not affiliated with Cloudflare, Inc.
What data can I see?
Pageviews, visitors, top pages, referrers, countries, browsers, and devices for every site, with filter and exclude so you can drill down, and period over period on every site.
Does it slow down my site?
No. There is nothing to add to your sites. My Web Dash reads Cloudflare Web Analytics through the official API.
How much does it cost?
Pricing is by the number of sites you bring into your dashboard, starting free for up to 10 sites. Prices are announced at launch.
When can I use it?
Sign in with Google and connect your Cloudflare account to start seeing your traffic. Pricing is announced at launch.
Which analytics does it read?
It reads Cloudflare Web Analytics through Cloudflare official GraphQL API. There is no script to add to your sites.
Stop clicking through the Cloudflare dashboard
A faster view of your Cloudflare Web Analytics, traffic first, across every site you run.